
Turning the Tide on Customer Churn
Introduction
In the rapidly evolving telecom sector, understanding and mitigating customer churn is essential. In this project, I employed advanced data science techniques to unravel churn patterns, aiding in the development of effective strategies for customer retention and business growth. Using predictive modeling, I aimed to identify customers with a high likelihood of discontinuing their services, a crucial step for proactive customer management.
Accounting Expertise Enhancing Data Science
Drawing from over 20 years of accounting experience, notably as a Revenue Manager, I brought a unique perspective to this data science project on telecom customer churn. My role in revenue management, with its focus on precision and strategic financial analysis, significantly enriched the project:
- Analytical Accuracy: Skills honed as a Revenue Manager in ensuring data accuracy informed rigorous validation in the analysis, leading to reliable insights.
- Revenue Perspective: Experience in revenue trend analysis helped in interpreting churn implications for business revenue, offering actionable insights.
- Risk and Compliance Insight: My background in managing financial risks and compliance contributed to a careful evaluation of model assumptions and potential errors.
- Business Strategy Alignment: As a Revenue Manager, aligning data with business strategy was key; I applied this to ensure that the project’s findings had practical applications.
- Effective Communication: Proficiency in communicating complex financial concepts, developed while reporting revenue insights, was crucial in making the data science findings accessible and actionable for stakeholders.
This blend of accounting, particularly in revenue management, and data science, not only heightened the project’s analytical rigor but also ensured the results were directly relevant to strategic business decisions.
Project Overview
In this project, I focused on combining thorough statistical analysis with practical business knowledge. The project revolved around a comprehensive dataset from a telecom company, where I aimed to create a predictive model to accurately identify the likelihood of customer churn. Recognizing the fluctuating nature of the telecom industry’s customer base, the ability to predict churn is crucial.
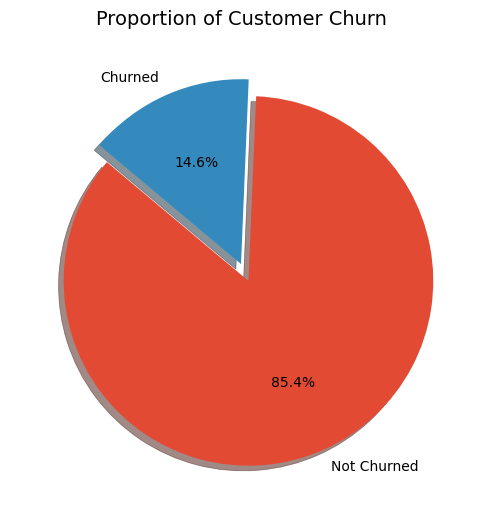
The accompanying pie chart depicts the distribution of customer churn within the dataset, revealing that 14.6% of customers have churned, while a substantial majority of 85.4% have not. This imbalance poses a particular challenge in predictive modeling, as it requires careful consideration to ensure that the model accurately identifies the minority class of churned customers without being overwhelmed by the majority class.
Dataset Overview
The backbone of this analysis was the Orange Telecom’s Churn Dataset, rich with intricate details about customer behaviors and churn trends. The dataset was bifurcated into training and testing segments, ensuring a comprehensive approach to model development and validation.
Below is a preview of the initial dataset used in the analysis.
Exploratory Data Analysis (EDA)
Data Exploration and Preprocessing
The initial stages were centered around refining the data for analysis:
- Data Integrity: Recognizing the critical impact of data completeness and reliability, I rigorously addressed any missing or inconsistent data, ensuring a robust base for analysis.
- Data Transformation: I converted categorical data into a numerical format, a necessary step for sophisticated modeling techniques that require quantifiable inputs.
- Outlier Management: Implementing robust scaling was crucial to minimize the influence of outliers, which are extreme data points that can skew analysis and model predictions.
In my thorough examination of the Orange Telecom’s Churn Dataset, I explored different data facets to unearth patterns that explain customer churn. The following visualizations illustrate key insights from this analysis.
Total Day Minutes and Churn
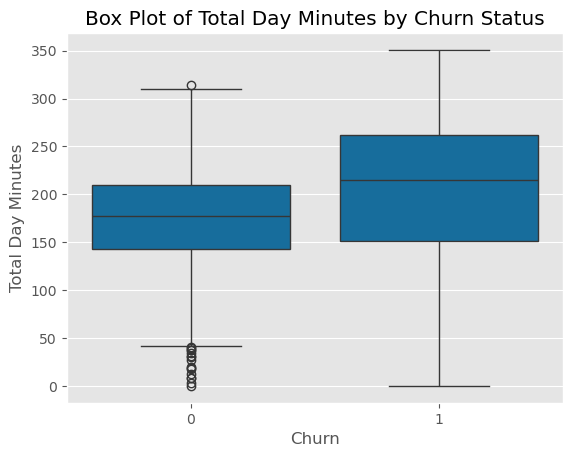
Analysis revealed a notable trend: customers logging more minutes during the day tended to churn at a higher rate. The accompanying box plot vividly displays this relationship, suggesting that extensive daily usage may contribute to customer dissatisfaction, possibly due to pricing or service quality issues, leading them to seek alternatives.
International Plan and Churn
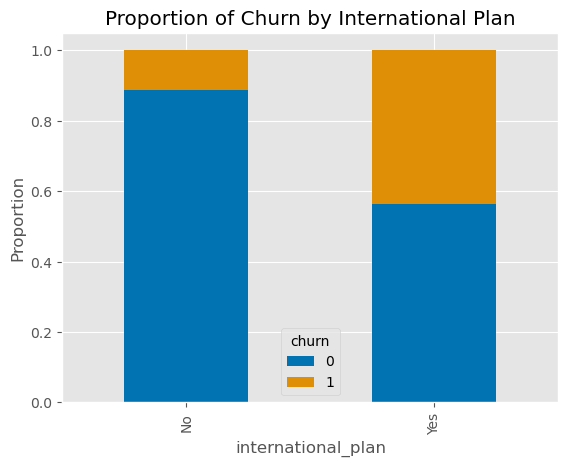
Another striking finding was the higher churn rate among customers enrolled in international plans. As shown in this bar graph, these customers churn more frequently, hinting at underlying problems with international plan features, pricing, or service quality that might not meet customer expectations.
Customer Service Calls and Churn
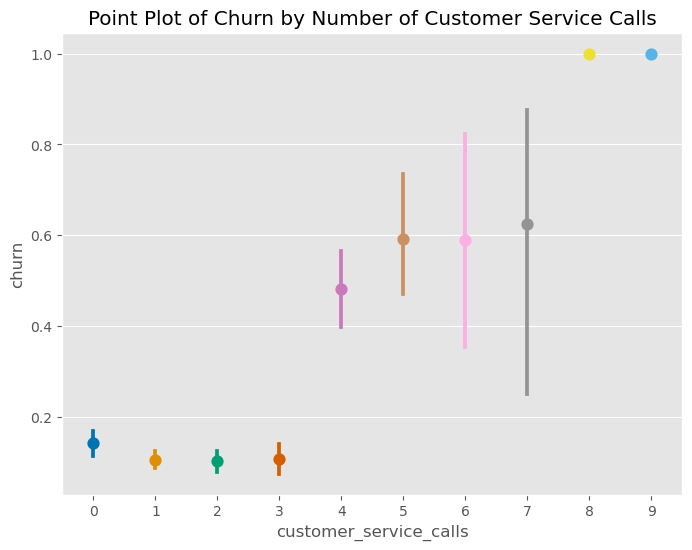
The data also indicated a strong link between the number of customer service calls and increased churn. This point plot clearly demonstrates that customers who frequently contact customer service are more likely to churn. This pattern likely reflects unresolved issues or customer frustration, emphasizing the need for effective customer service to enhance retention.
Model Selection
In this project, I utilized two esteemed models, Random Forest and Gradient Boosting, to predict customer churn, particularly focusing on the challenge posed by an imbalanced dataset.
Random Forest Model
- Approach: Constructs multiple decision trees, combining their outputs for a more accurate and stable prediction.
- Strengths: Effectively combats overfitting, adept at managing imbalanced data, and provides insights on feature importance.
Gradient Boosting Model
- Approach: Builds the model in stages, with each successive tree improving on the previous one’s errors.
- Strengths: High precision, flexible across various loss functions, and excels at identifying complex interactions between features.
Model Development
Stratified K-Fold Cross-Validation
Understanding the importance of accurate model validation, I employed Stratified K-Fold Cross-Validation. This approach ensures that each fold of the dataset accurately represents the overall distribution of the churn classes, which is crucial for our imbalanced data.
stratified_kfold = StratifiedKFold(n_splits=5, shuffle=True, random_state=42)
By choosing five splits, the model training and validation phases could capture the underlying data patterns without being biased toward the majority class.
Weight Adjustment
The Random Forest model was fine-tuned with a focus on the minority class by adjusting the class weights. This method effectively increases the penalty for misclassifying the less frequent, but critical, churn cases.
weight_ratios = np.linspace(0.1, 15.0, 50)
class_weight_options = [{0: 1, 1: ratio} for ratio in weight_ratios]
Experimentation with various weight ratios allowed for finding the optimal balance, enhancing the model’s ability to identify churn customers accurately.
Subsampling
Gradient Boosting was implemented with subsampling to address overfitting, a common concern with imbalanced datasets. Training on random subsets of the data aids in building a model that generalizes well on unseen data.
param_dist_gb = {'subsample': [0.5, 0.6, 0.7, 0.8, 0.9, 1.0]}
This technique introduces randomness into the model training process, improving the robustness of the predictions.
Recall Optimization
The model’s performance was optimized for recall to ensure maximum identification of actual churn cases. In our business context, capturing true churn instances is more critical than achieving high precision.
param_dist_gb = {'scoring': 'recall'}
By focusing on recall, the models are tailored to detect churn patterns effectively, even if it means slightly higher false positives, which is a trade-off in imbalanced datasets.
Model Performance
Our analysis highlights the importance of recall in predicting customer churn, where capturing the majority of churn cases is more critical than the precision of the prediction due to the imbalanced nature of our dataset:
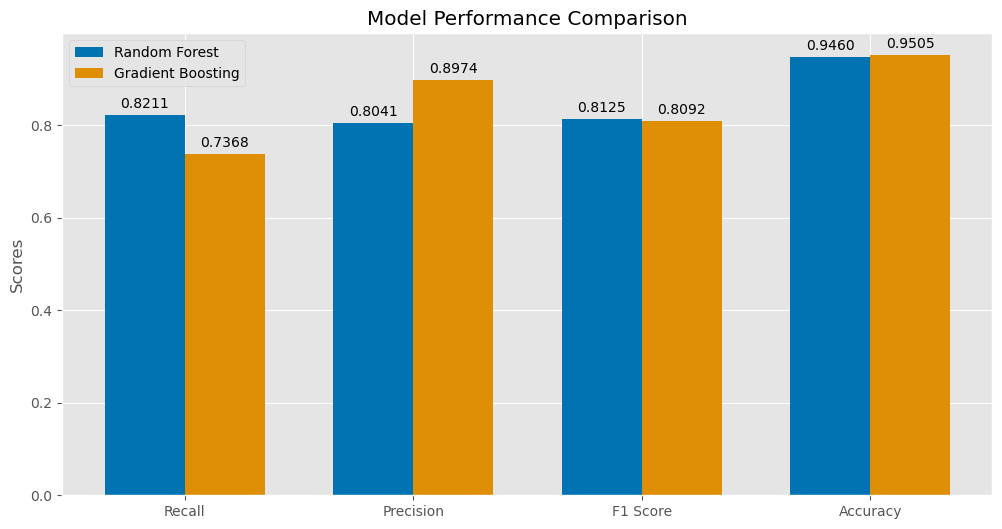
- Recall: The Random Forest model demonstrated a superior recall of 82.11%, indicating its strength in identifying true churn cases, which is crucial for minimizing the risk of false negatives.
- Precision: Although Gradient Boosting had a slightly lower recall of 73.68%, its precision rate of 89.74% reflects its effectiveness in correctly labeling customers who are likely to churn.
- F1 Score & Accuracy: Both models performed comparably in F1 Score, with Random Forest at 81.25% and Gradient Boosting slightly lower at 80.92%. Despite the focus on recall, both models achieved high accuracy, with Gradient Boosting slightly ahead.
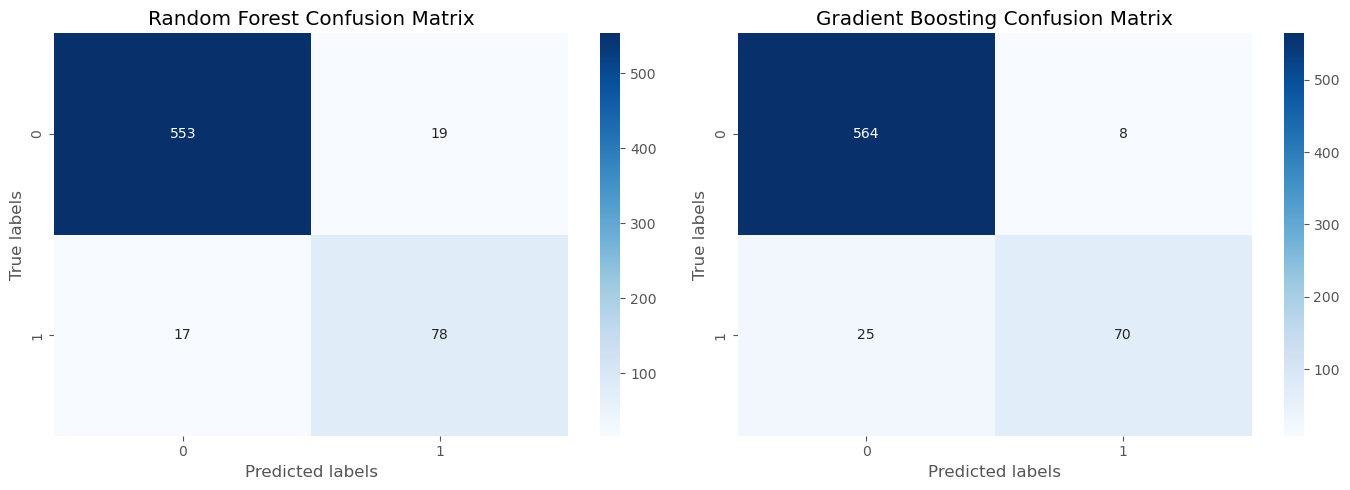
Confusion Matrix Analysis
The confusion matrices further illustrated the models’ strengths. Random Forest correctly identified 78 churned customers but had 17 false negatives, suggesting room for improvement in churn prediction. In contrast, the Gradient Boosting model correctly predicted 70 churn instances, with 25 false negatives, showcasing its strength in pinpointing customers at risk of churn.
The evaluation of our models zeroes in on recall—a crucial metric given the imbalanced nature of our churn dataset:
Precision-Recall Curve Comparison
The Precision-Recall Curve is a model evaluation metric that graphically demonstrates the trade-off between the precision of a predictive model and its recall (true positive rate) at different threshold settings. The area under the curve (AUC) provides a single metric to compare models. In our churn prediction project, this metric is particularly insightful due to the class imbalance inherent in the dataset.
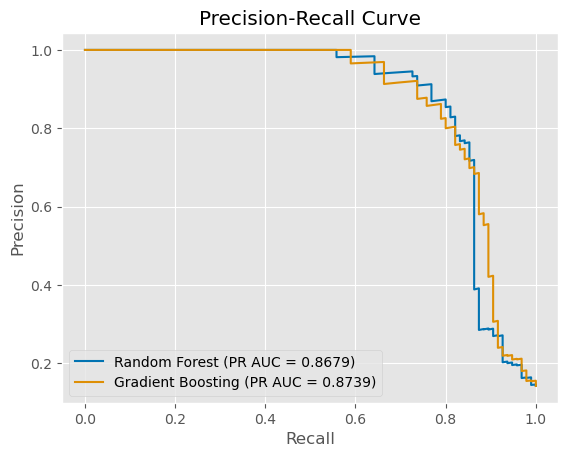
- Random Forest: Exhibited a strong performance with a PR AUC of 0.8679, suggesting a robust balance between precision and recall across different thresholds.
- Gradient Boosting: The Gradient Boosting model showed a slightly better PR AUC of 0.8739, indicating its efficiency in maintaining precision while maximizing recall.
The comparison reveals that while both models are quite effective, Gradient Boosting edges out slightly in terms of the area under the Precision-Recall Curve. This suggests that for this particular dataset, Gradient Boosting may be the more appropriate choice when optimizing for a balance between identifying as many true churn cases as possible (recall) while maintaining precision.
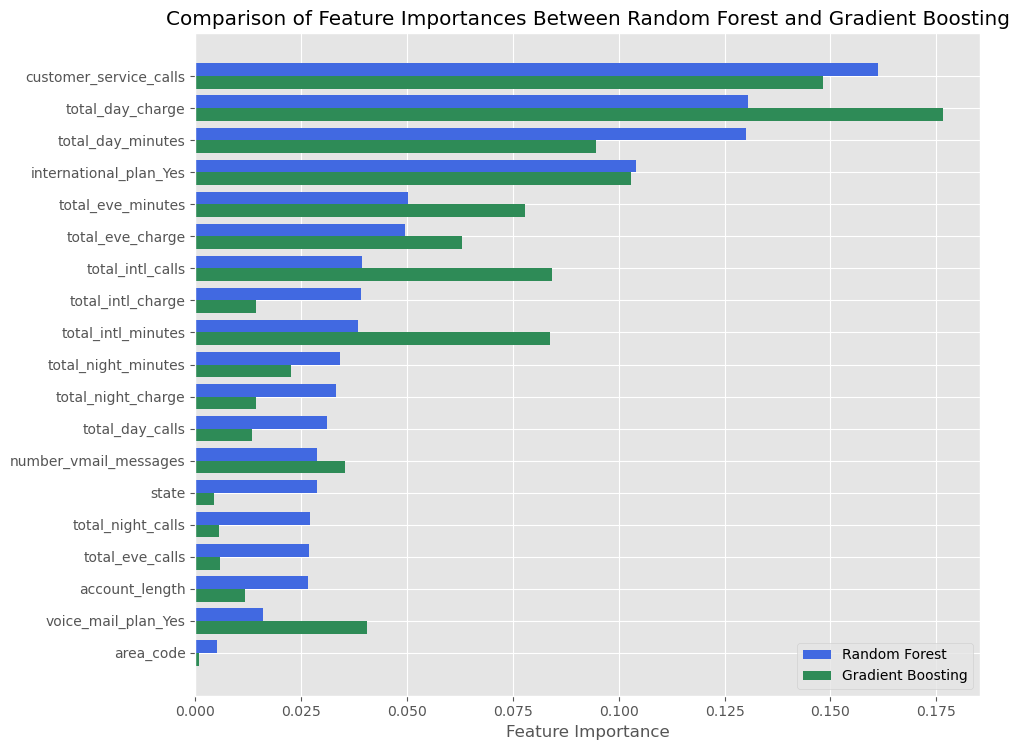
Feature Importances Comparison
Analyzing the feature importances from our Random Forest and Gradient Boosting models gives us insight into the factors most predictive of customer churn. Both models highlight similar features as significant, but with some differences in the degree of importance attributed to each feature.
-
Customer Service Calls: The number of customer service calls is a strong predictor in both models, with a notably high importance in the Random Forest model. This suggests a direct link between service calls and churn likelihood, underscoring the importance of customer service quality.
-
Total Day Charge: For both models, the total day charge is a prominent feature, which may indicate that higher charges during the day contribute to customer churn.
-
Total Day Minutes: This feature is a top predictor for churn, with both models assigning it high importance. It appears that longer call durations are associated with a greater chance of customers leaving the service.
-
International Plan: The presence of an international plan is a more significant predictor in the Gradient Boosting model than in Random Forest, suggesting that factors related to international calling plans may influence the decision to churn.
The bar chart comparison above provides a visual representation of these key features’ importances, indicating where each model’s predictive focus lies. Notably, the first four features listed are among the most critical across both models. Targeting improvements in these areas could be beneficial in reducing churn rates.
Strategic Actions to Mitigate Customer Churn
Enhancing Customer Support
- Focus on Service Quality: With customer service calls being a leading indicator of churn, invest in training and resources to improve the quality of customer support.
- Proactive Problem Resolution: Implement robust follow-up procedures to ensure customer issues are resolved promptly, reducing the need for multiple service calls.
Pricing Plan Optimization
- Flexible Pricing Plans: Given the significance of total day minutes and charges, introduce flexible pricing plans that adapt to customer usage patterns, potentially with tiered pricing or pay-as-you-go options.
- Incentivize High Usage: Develop discounts or special offers that reward high usage, making the pricing more appealing and encouraging customer loyalty.
International Plan Competitiveness
- Review Plan Offerings: Analyze the competitiveness of international plans. Customer churn associated with these plans suggests a need for more attractive offerings.
- Attractive International Rates: Consider offering better international rates or bundled minutes to appeal to customers who frequently use international services.
Implementing Data-Driven Actions
- Use the insights from the data to inform strategic decisions, ensuring that actions taken are data-driven and targeted at reducing churn.
- Continually monitor the impact of these strategies and adjust as necessary based on customer feedback and ongoing data analysis.
Reflecting on the Journey
Overcoming Challenges and Personal Growth
This project was more than just a technical task; it was a journey of personal and professional growth. The challenges faced, from understanding complex telecom data to balancing technical and business insights, have been integral to my development. They pushed me to refine my data processing and analysis skills, emphasizing the importance of adaptability and continuous learning in the dynamic field of data science.
Project Impact and Future Directions
Completing this customer churn project independently marks a notable milestone in my data science journey. It has not only demonstrated my ability to address complex business challenges with rigorous predictive modeling and thorough data analysis, but also sharpened my skills in model evaluation and data-driven decision-making. This experience underlines my capability to derive meaningful insights from intricate data scenarios.
Looking ahead, I am excited to delve deeper into advanced modeling techniques and to work with broader datasets. My commitment to embracing cutting-edge methodologies, like deep learning, highlights my potential as a valuable contributor in data-focused roles. This project has been a testament to my innovative problem-solving and strategic analytical skills, positioning me for future opportunities where I can drive impactful business solutions.
To explore the full analysis with all executed code, outputs, and visualizations, see the complete notebook on NBViewer.