
Boosting Profitability with Strategic Customer Segmentation
Introduction
In a market as diverse as it is competitive, understanding the customer base is not just an advantage; it’s a necessity. This deep dive into hierarchical clustering sheds light on how customers can be segmented into meaningful groups based on behavior and value, allowing businesses to tailor their marketing approaches with unparalleled precision.
Leveraging Experience
With over 20 years of comprehensive experience in revenue accounting and a recent focus on data science, I bring a unique blend of skills to this project. My background as a CPA in the software/SaaS industry in Silicon Valley has equipped me with a keen understanding of financial data and the importance of accurate, data-driven decision-making. Here are some specific ways my prior experience benefited this project:
- Data Quality and Integrity: Having led numerous software implementations and managed large datasets, I ensured that the data used for this analysis was clean and reliable. My experience with SQL and data manipulation in Python was instrumental in preprocessing and preparing the dataset for analysis.
- Financial Insights: My extensive background in revenue recognition and financial management provided valuable insights into the monetary aspects of customer behavior. This understanding helped in accurately interpreting the Monetary value metric of the RFM analysis.
- Analytical Skills: Applying my knowledge of statistical analysis and machine learning, I utilized hierarchical clustering to uncover meaningful patterns in customer data. This analytical approach was honed through years of financial modeling and predictive analytics in my previous roles.
The Concept of RFM Analysis
Imagine running a bustling store, where customers of all ages and backgrounds walk in and out every day. Some are loyal patrons who visit frequently and spend generously, while others drop by occasionally, making modest purchases. To turn this diverse crowd into well-defined segments, I turned to RFM analysis—a tried and true method for understanding customer behavior.
RFM stands for Recency, Frequency, and Monetary value. By examining these three dimensions, a detailed profile of each customer can be created. Let’s break down these components:
-
Recency (R): This measures how recently a customer made a purchase. The idea is that customers who purchased recently are more likely to buy again compared to those who haven’t purchased in a long time. Recency helps in identifying active and engaged customers.
-
Frequency (F): This looks at how often a customer makes a purchase. Frequent buyers are usually more loyal and tend to generate more revenue over time. By identifying frequent purchasers, businesses can focus their retention efforts on this valuable group.
-
Monetary Value (M): This indicates how much money a customer spends on purchases. High-spending customers are often the most valuable and warrant special attention to ensure their continued patronage.
By combining these three metrics, customers can be segmented based on their purchasing behaviors and identify key groups such as high-value customers, frequent buyers, and recently active customers. This segmentation is crucial for predicting future customer value and crafting targeted marketing strategies.
Data Collection and Preprocessing
The journey began with collecting transaction data. This dataset was a treasure trove of information, including every sale made over the past year. However, raw data can be messy, so the first step was to clean and preprocess it. This involved removing any anomalies, normalizing values, and deriving new variables like ‘Customer Lifetime Value (CLV)’, which would play a pivotal role in the analysis.
Exploratory Data Analysis (EDA)
With the data in good shape, the next step was to embark on exploratory data analysis (EDA) to uncover patterns and gain a better understanding of the customers. EDA is like getting to know your audience before planning a big event—it’s essential to know who you’re dealing with.
Correlation Matrix
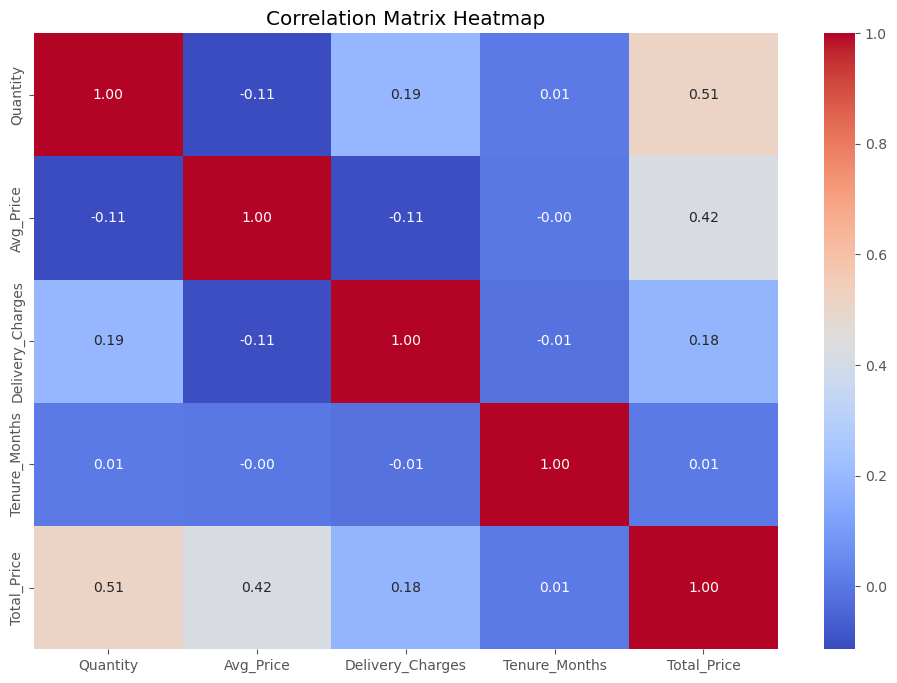
The correlation matrix depicted the relationships between RFM factors, guiding the segmentation strategy by ensuring that strongly correlated factors were grouped together, leading to more meaningful clusters.
Distribution of Customer Lifetime Value (CLV)
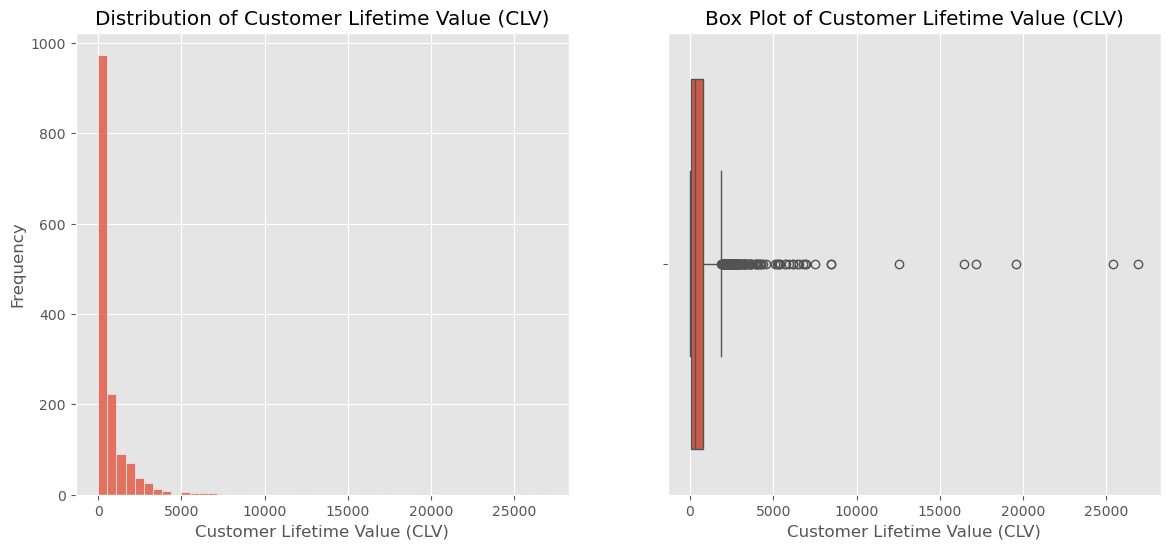
As the distribution of Customer Lifetime Value (CLV) was plotted, an intriguing picture emerged. Most customers had a moderate lifetime value, indicating steady, consistent spending. However, a select few stood out with significantly higher values—these were the premium customers who contributed a substantial portion of the revenue. Identifying these high-value customers was crucial for designing exclusive offers and personalized experiences that would keep them coming back.
Distribution of Tenure Months
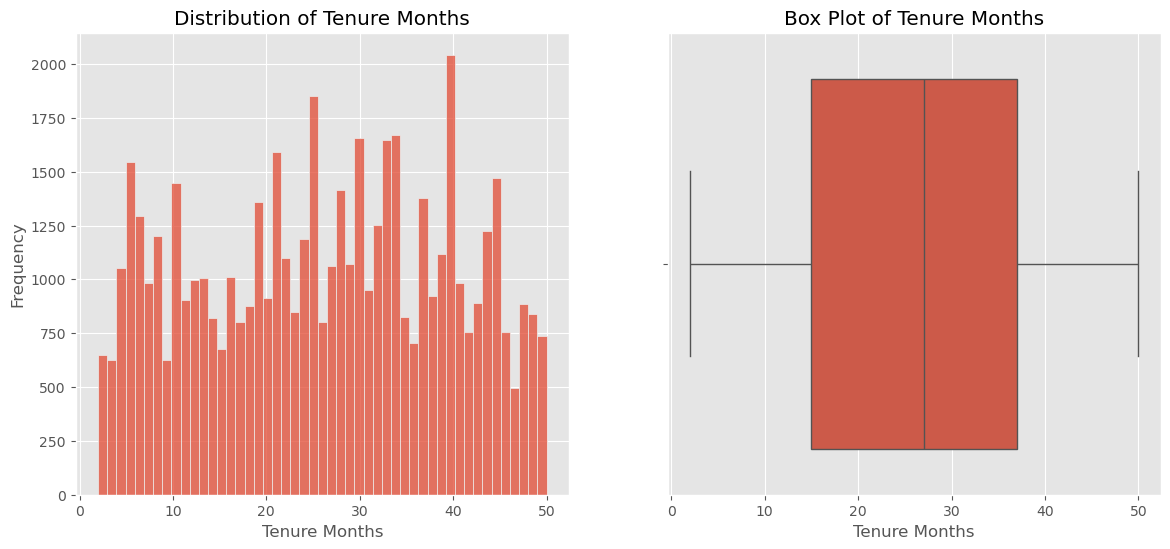
Next, the tenure months—the length of time customers had been with the store—were examined. The distribution revealed some interesting trends. There were peaks at certain intervals, suggesting common durations for customer engagement. Understanding these patterns helped in devising strategies to enhance customer retention and extend their lifecycle with the store.
Implementing Clustering Techniques
With a clear understanding of the data, it was time to delve into clustering techniques. Both K-means and hierarchical clustering were employed to identify the natural groupings within the data.
K-means Clustering
K-means clustering is a popular method due to its simplicity and efficiency. It partitions the data into K clusters by minimizing the variance within each cluster. However, it requires the number of clusters (K) to be specified beforehand.
Silhouette Scores for Different Numbers of Clusters in K-means
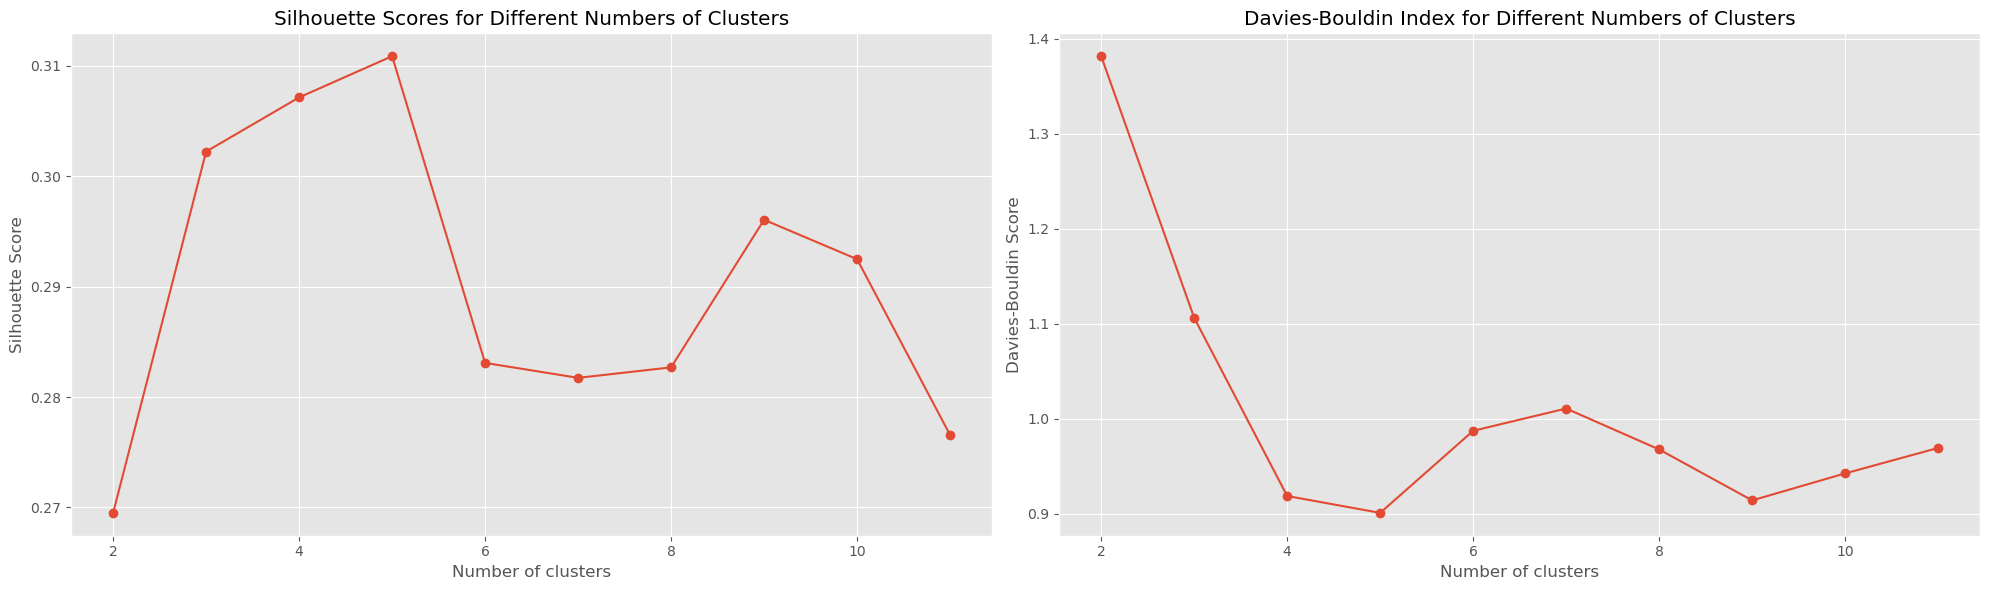
To determine the optimal number of clusters, silhouette scores were used, which measure how similar each customer is to their own cluster compared to other clusters. Higher silhouette scores indicate better-defined clusters. Several values of K were evaluated, and the number of clusters with the highest silhouette score was selected for optimal clustering.
K-means Cluster Visualization
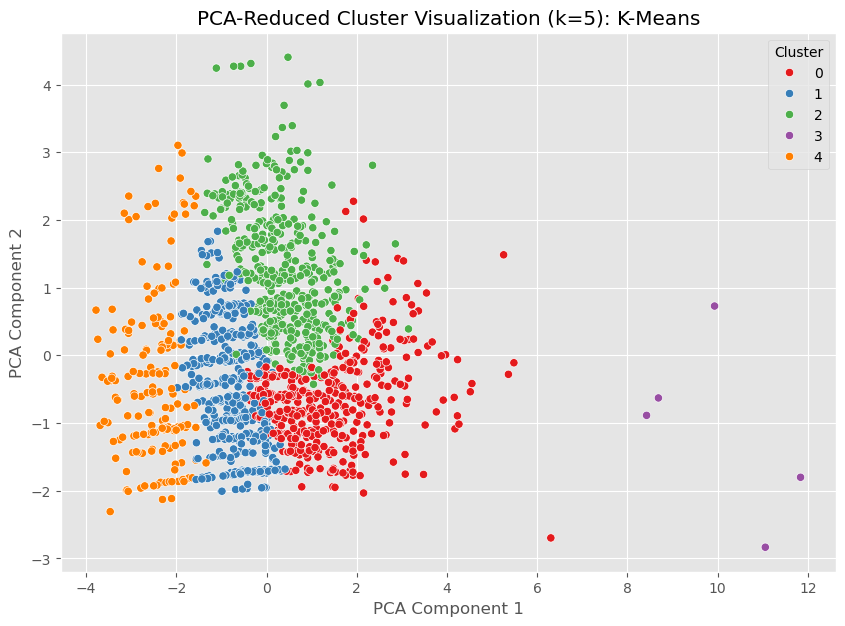
After selecting the optimal number of clusters, the clusters were visualized using Principal Component Analysis (PCA) to reduce the data’s dimensionality. The scatter plot showed distinct groupings, validating the effectiveness of the K-means clustering.
Hierarchical Clustering
Hierarchical clustering builds a tree-like structure of clusters without requiring a predefined number of clusters. It reveals the natural hierarchy and relationships within the data.
Hierarchical Clustering Dendrogram
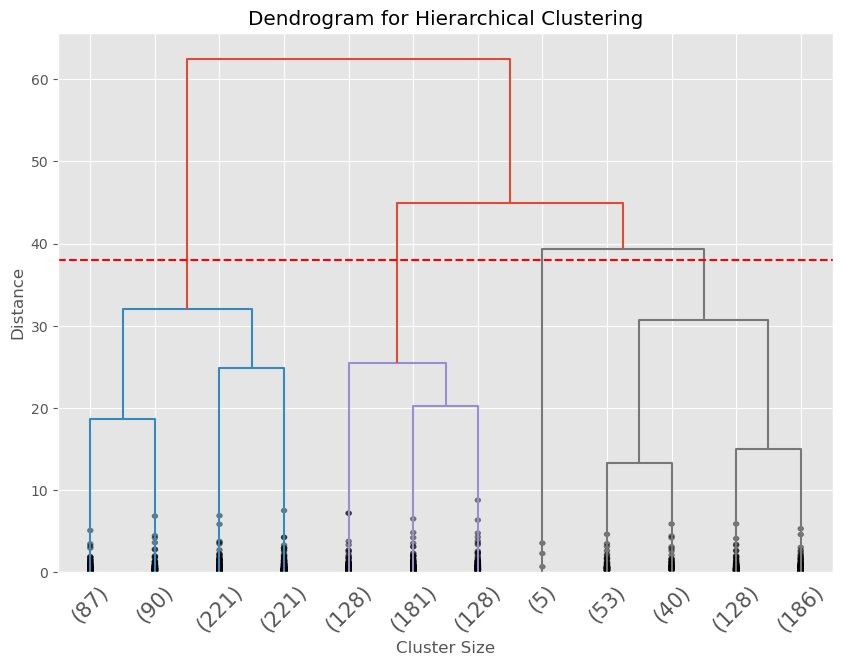
The dendrogram showed how clusters were formed and merged. By tracing the branches, natural breakpoints to define distinct customer segments were identified.
Analyzing Cluster Characteristics
Once the hierarchical clustering was completed, the clusters were analyzed to understand their characteristics. This analysis involved examining the mean values of RFM metrics within each cluster, providing insights into the behavior and value of each customer segment.
Results and Analysis
Both clustering methods revealed distinct customer segments, each with unique characteristics and behaviors. The choice between K-means and hierarchical clustering depends on the specific requirements and constraints of the analysis.
Segment Characteristics and Strategies
K-Means Clustering (k=5)
- Cluster 0 (Red):
- Characteristics: High engagement and frequent shopping with the highest spending.
- Strategies: Introduce VIP programs and target with premium products.
- Cluster 1 (Blue):
- Characteristics: Moderate engagement and spending.
- Strategies: Enhance loyalty programs and provide personalized discounts.
- Cluster 2 (Green):
- Characteristics: Moderate frequency and spending, varied purchasing behavior.
- Strategies: Focus on cross-selling and targeted promotions.
- Cluster 3 (Purple):
- Characteristics: Low engagement and infrequent shoppers with lower spending.
- Strategies: Implement reactivation campaigns and gather feedback for personalized offers.
- Cluster 4 (Orange):
- Characteristics: Frequent shoppers with high engagement and significant spending.
- Strategies: Offer early access to new products and premium memberships.
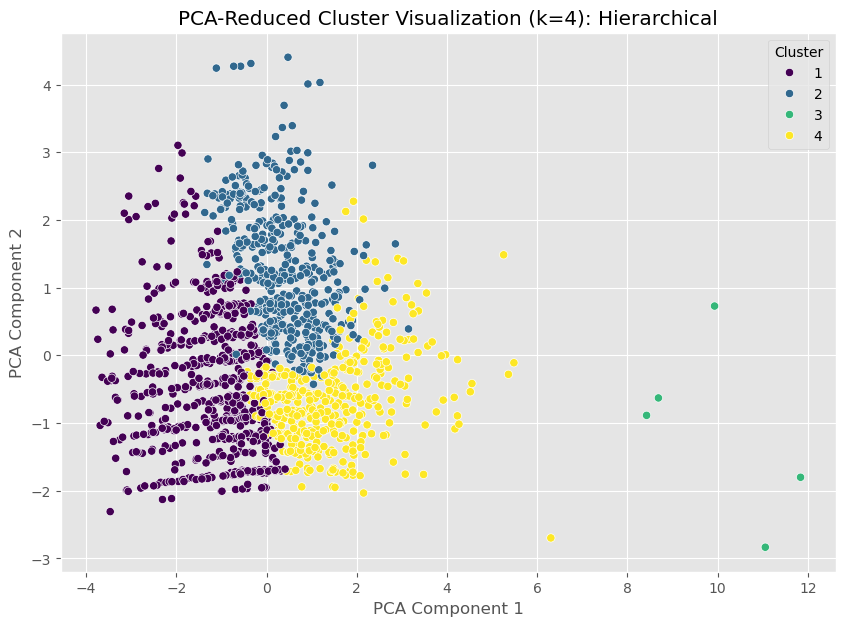
Hierarchical Clustering (k=4)
- Cluster 1 (Dark Purple):
- Characteristics: Highly engaged and frequent shoppers with significant spending.
- Strategies: Organize exclusive events and provide top-tier rewards.
- Cluster 2 (Blue):
- Characteristics: Moderately engaged with steady purchasing patterns.
- Strategies: Offer subscription services and implement cross-selling strategies.
- Cluster 3 (Green):
- Characteristics: Less engaged and infrequent shoppers with lower spending.
- Strategies: Launch win-back campaigns and targeted promotions.
- Cluster 4 (Yellow):
- Characteristics: Highly engaged, frequent shoppers with high spending.
- Strategies: Introduce premium product lines and enhance personalized communication.
Summary
By accurately mapping the clusters to their respective characteristics, tailored marketing strategies can be developed for each customer segment. This ensures that each segment receives personalized and relevant offers, enhancing customer satisfaction, increasing engagement, and driving revenue growth.
To explore the full analysis with all executed code, outputs, and visualizations, see the complete notebook on NBViewer.


.jfif)