
Predicting Popular Recipes: A Comprehensive Data Science Approach
Introduction
Transitioning from a 25-year career in accounting to data science allowed me to apply my analytical skills in innovative ways. This project aimed to predict popular recipes for a recipe website, with the goal of ensuring that 80% of the recipes featured on the homepage are likely to be popular. This involved data validation, exploratory data analysis (EDA), predictive modeling, and model evaluation.
Project Objectives
The primary objectives of this project were:
- To develop a model that predicts the popularity of recipes with at least 80% accuracy.
- To minimize the display of unpopular recipes on the homepage, thereby increasing user engagement.
- To use the insights gained to inform and optimize content strategy for the website.
Dataset Overview
The dataset consisted of various features related to recipes, including nutritional content (calories, carbohydrates, protein, sugar), category labels, and user engagement metrics. Data cleaning was essential to handle missing values, encode categorical variables, and prepare the dataset for analysis.
Technologies and Tools Used
- Python for data processing and modeling.
- Pandas and NumPy for data manipulation.
- Seaborn and Matplotlib for data visualization.
- Scikit-Learn for model selection, training, and evaluation.
Analysis and Methodology
The analysis began with comprehensive data cleaning, followed by EDA to understand the distribution and relationships between variables.
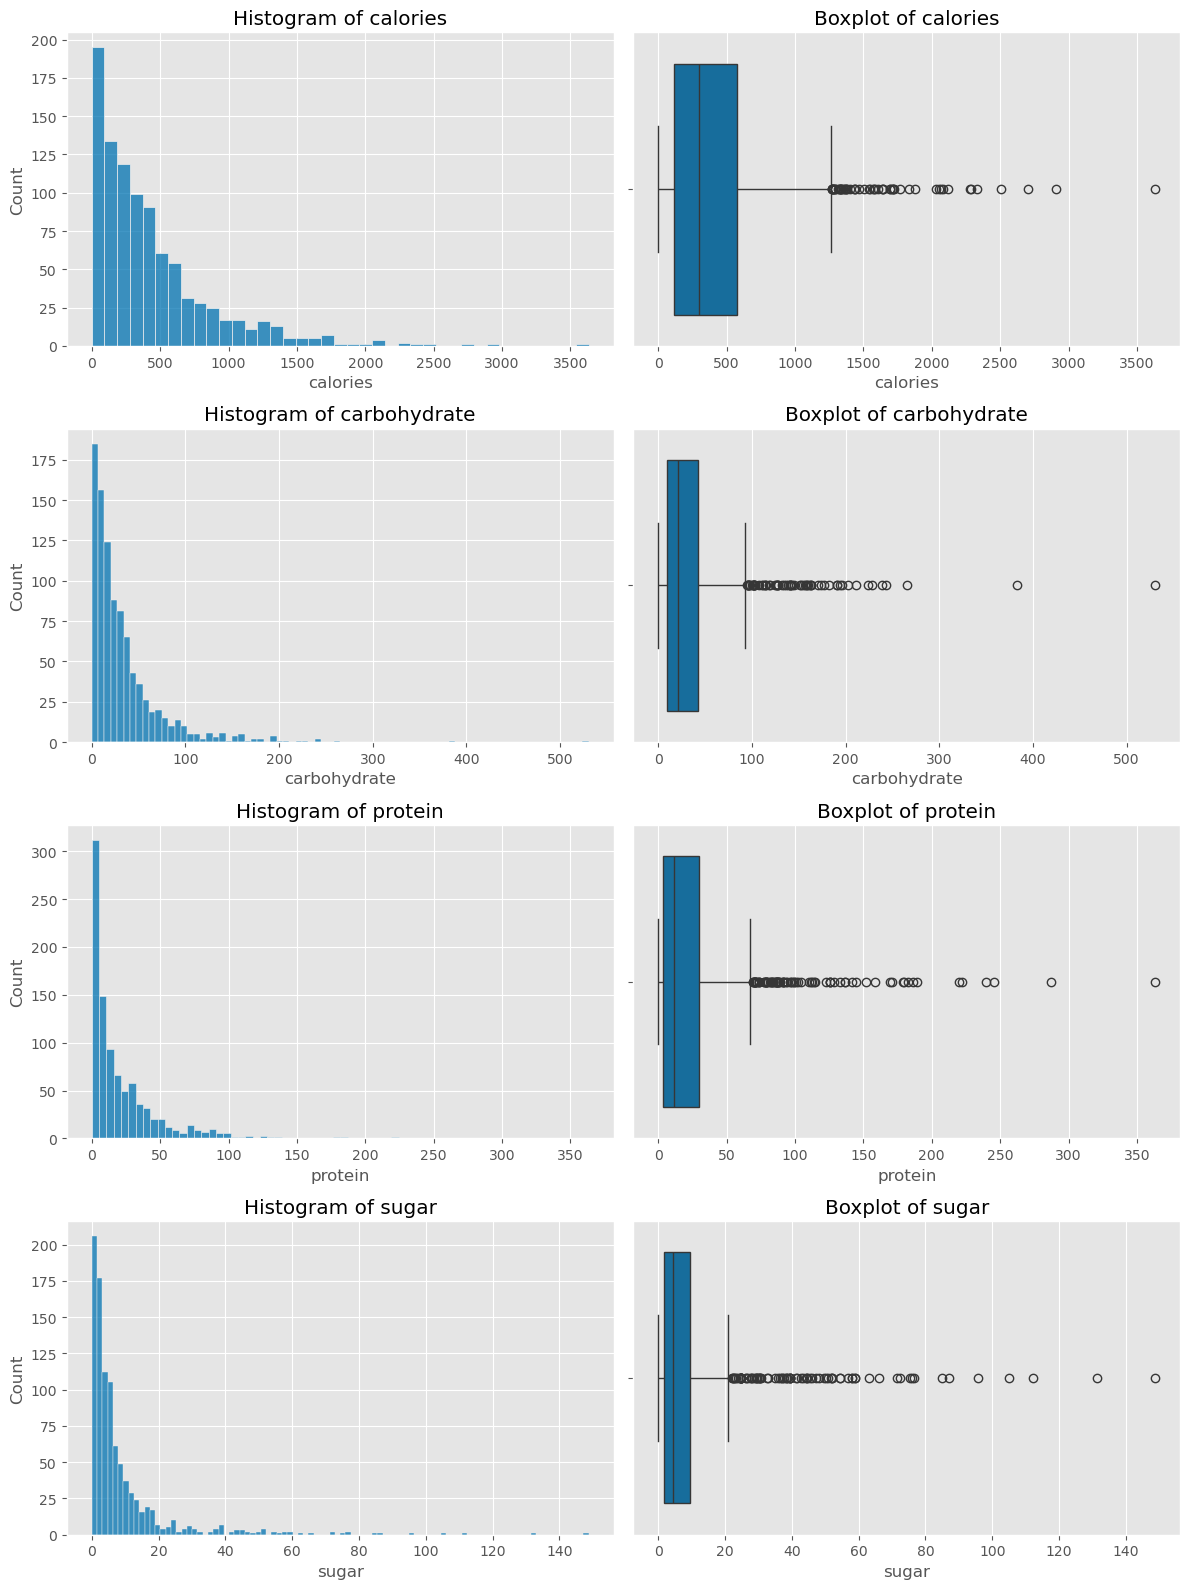
Distribution Analysis:
To understand the spread and skewness of the nutritional content within the recipes, I plotted histograms and boxplots for calories, carbohydrates, protein, and sugar. The histograms revealed that most recipes had lower values for these nutritional elements, but outliers were present, contributing to skewness in the data. These outliers were visually emphasized in the boxplots.
Correlation Analysis:
I then analyzed the correlations between the nutritional variables and the high-traffic indicator. The correlation matrix highlighted that while most correlations were weak, there was a noticeable positive correlation between calories and protein. This insight suggested that these variables might independently influence whether a recipe becomes popular.
Model Selection and Evaluation:
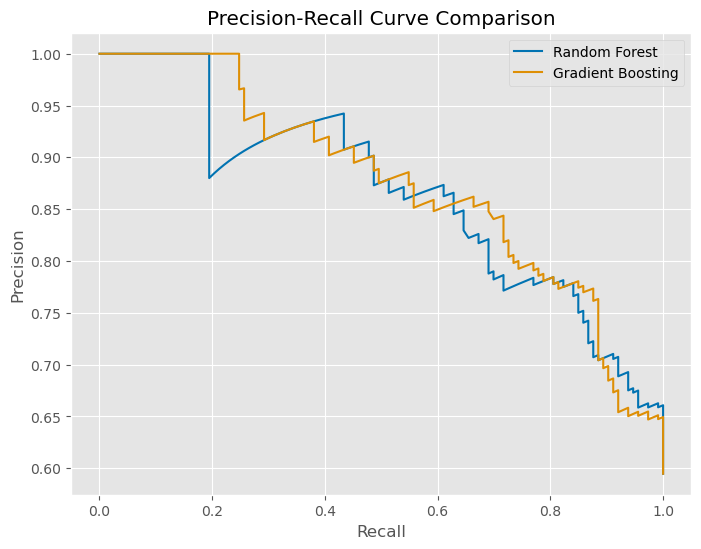
Based on the insights gained from the EDA, I selected Random Forest and Gradient Boosting models for their ability to handle large, complex datasets. These models were fine-tuned using cross-validation, and their performance was assessed using precision, recall, and F1 scores.
Model Evaluation:
To ensure the model’s robustness, I evaluated the Precision-Recall curve, which illustrated the trade-offs between precision and recall at various thresholds. This curve was crucial for selecting the optimal threshold that maximizes the model’s ability to correctly identify high-traffic recipes while minimizing false positives.
Actionable Strategies and Key Insights
- Content Strategy: Focus on recipe categories like “Vegetable,” “Potato,” and “Pork,” which have a higher likelihood of driving user engagement.
- Model Maintenance: Regular updates with new data are crucial to maintain model accuracy, especially as trends and user preferences evolve.
- User-Centric Refinements: Incorporate user feedback and behavior data to further refine the model and adapt to changing preferences.
Challenges and Learning Experiences
One of the key challenges was transitioning from a long-standing career in accounting to mastering data science techniques. This project pushed me to learn and apply new skills in data processing, feature engineering, and model evaluation. It also emphasized the importance of continuous learning and adaptability in the fast-evolving field of data science.
Reflections and Looking Ahead
This project marked a significant milestone in my data science journey. It showcased my ability to leverage past experience in a new domain and apply advanced predictive modeling to solve real-world business problems. Looking ahead, I am excited to explore more complex datasets and advanced techniques, including deep learning and ensemble models, to drive even more impactful insights and business solutions.
Discover the Full Story
Explore the comprehensive analysis and dive deeper into the data, methodology, and insights by visiting the detailed project page here.
Explore the Technical Journey
For those interested in the technical details, including the complete code and methodologies, view the project notebook on NBViewer: Explore the Notebook.