
Predicting Popular Recipes: A Comprehensive Data Science Approach
Introduction
Transitioning from a 25-year career in accounting to data science has allowed me to leverage my analytical skills in new and exciting ways. The primary goal of this project is to predict which recipes will be popular 80% of the time and minimize the chance of showing unpopular recipes on the company’s homepage. This analysis involves data validation, cleaning, exploratory data analysis (EDA), model selection, and performance evaluation.
Leveraging Accounting Skills in Data Science
My background in accounting has provided me with valuable skills that translate well into data science:
-
Data Accuracy and Validation:
Ensuring the accuracy of financial records is crucial in accounting, and I applied this meticulous approach to data analysis. The data was thoroughly cleaned, checked for inconsistencies, and validated to ensure the reliability of the insights. -
Trend Analysis:
Experience in financial forecasting and trend analysis provided a strong foundation for analyzing data trends. By applying time series analysis, I detected seasonal trends and spikes in user engagement, similar to how revenue trends are analyzed over fiscal quarters. -
Decision-Making Support:
In accounting, I translated complex financial data into actionable recommendations. Similarly, my analysis of the site’s traffic data supported strategic business decisions by identifying patterns and trends. -
Automation and Process Optimization:
Automating financial processes to improve efficiency and reduce errors was a significant part of my accounting career. I applied the same mindset to data analysis, using Python scripts to automate data extraction, cleaning, and preliminary analysis, ensuring consistency and efficiency.
Initial Data Cleaning
The initial data cleaning process was critical to preparing the dataset for analysis. This included handling missing values, transforming data, and encoding categorical variables:
# Fill missing high_traffic values. For the target variable, NaN actually represents the values that are not 'High'.
# Fill NA values (not high traffic) with 0.
recipes['high_traffic'].fillna(0, inplace=True)

# Change 'High' values in high_traffic to 1
recipes.loc[recipes['high_traffic'] == 'High', 'high_traffic'] = 1

# Convert high_traffic to binary (integer)
recipes['high_traffic'] = recipes['high_traffic'].astype('int')

# Fill missing values in 'protein', 'sugar', 'carbohydrate', and 'calories' with the median value of their respective category
for column in ['protein', 'sugar', 'carbohydrate', 'calories']:
    recipes[column] = recipes.groupby('category')[column].transform(lambda x: x.fillna(x.median()))
Initial Data Cleaning Insights
- Recipe: This numeric variable serves as the unique identifier for each recipe. No additional cleaning was required.
- Calories, Carbohydrate, Sugar, Protein: These columns had missing values, which I filled using the median value within each category.
- Category: No missing values were found; categorical data was handled with
OneHotEncoder. - Servings: No missing values were found; the data was converted to numeric and scaled.
- High_Traffic: This column was converted to a binary format.
Exploratory Data Analysis (EDA)
Distribution Analysis
Understanding the distribution of numerical features was crucial. I plotted their distributions to identify skewness, the presence of outliers, and the overall spread of values. The histograms and boxplots provided visual insights into the central tendencies and variances of key nutritional content variables.
# Select numeric columns for plotting
numeric_columns = ['calories', 'carbohydrate', 'protein', 'sugar']

# Set number of rows based on number of numeric columns
num_rows = len(numeric_columns)

# Create subplots, set figsize
fig, axes = plt.subplots(nrows=num_rows, ncols=2, figsize=(12, num_rows * 4))

# Loop through relevant numeric variables
for i, col in enumerate(numeric_columns):
    # Plot histogram on the left
    sns.histplot(recipes[col], ax=axes[i, 0])
    axes[i, 0].set_title(f'Histogram of {col}')

    # Plot boxplot on the right
    sns.boxplot(x=recipes[col], ax=axes[i, 1])
    axes[i, 1].set_title(f'Boxplot of {col}')

# Display plot
plt.tight_layout()
plt.show()
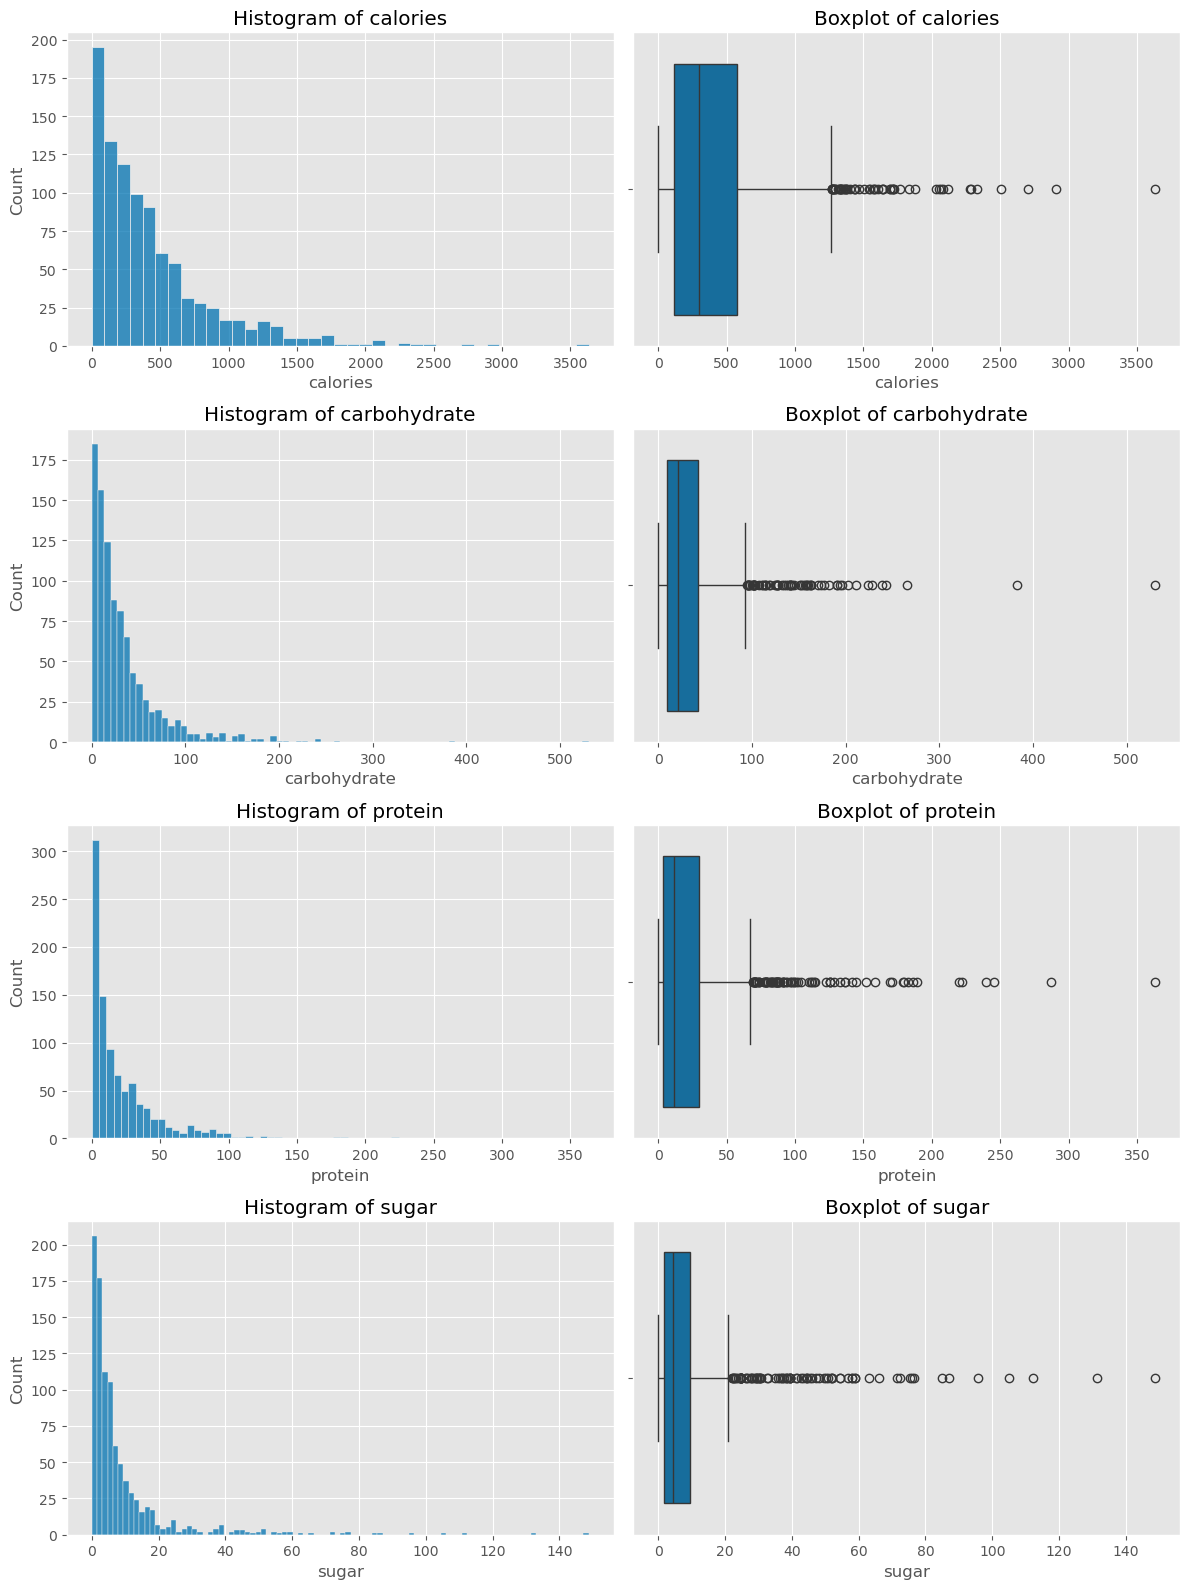
Summary:
The histogram plots indicate that the majority of recipes have lower calorie, carbohydrate, protein, and sugar content. However, the presence of outliers, as seen in the boxplots, suggests that some recipes are much higher in these nutritional metrics, contributing to skewness in the data.
Correlation Analysis
Correlation analysis was used to examine the relationships between different numerical variables. By analyzing the correlation matrix, I identified relationships between variables, providing insights for feature selection and model interpretation.
# Generate correlation heatmap
sns.heatmap(recipes.corr(), annot=True, cmap='coolwarm')
plt.show()
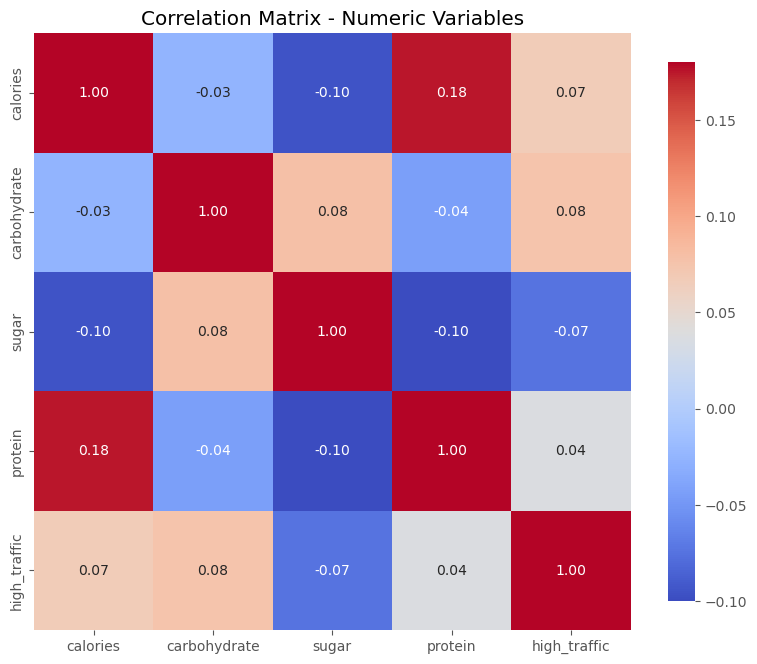
Summary:
The correlation matrix reveals generally weak correlations between the nutritional variables, with the strongest correlation being between calories and protein. This suggests that these nutritional components largely function independently when predicting whether a recipe will be high-traffic.
Category Analysis
Examining the proportion of high-traffic recipes by category provided insights into user preferences. The following bar plot was used to visualize the average high-traffic rate across different recipe categories.
# Calculate high-traffic proportion by category
high_traffic_by_category = recipes.groupby('category')['high_traffic'].mean()

# Sort and plot results
high_traffic_by_category.sort_values(ascending=False).plot(kind='bar')
plt.show()
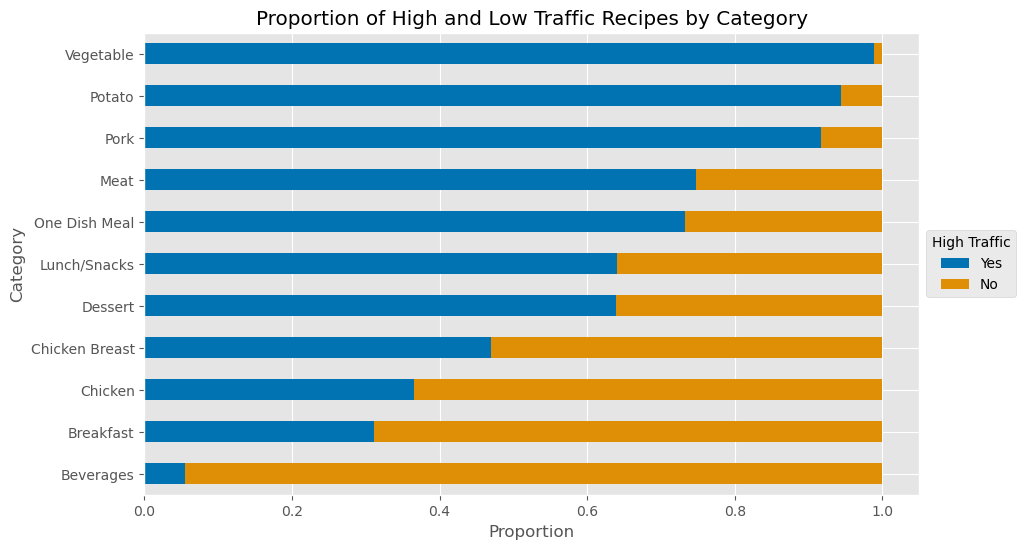
Summary:
The bar plot shows that certain categories, such as “Vegetable,” “Potato,” and “Pork,” have higher proportions of high-traffic recipes. This suggests that users may have a preference for recipes in these categories, making them key areas to focus on for content strategy.
Model Selection and Evaluation
The model selection process involved choosing algorithms that are well-suited to the complexity and structure of the dataset. For this project, I selected Random Forest and Gradient Boosting models because of their ability to handle large datasets with high-dimensional features and their robustness against overfitting. These models are also interpretable, which is important for understanding the factors that contribute to a recipe’s popularity.
Model Selection
from sklearn.ensemble import RandomForestClassifier, GradientBoostingClassifier
from sklearn.model_selection import train_test_split, cross_val_score

# Split data into train and test sets
X = recipes.drop('high_traffic', axis=1)
y = recipes['high_traffic']

X_train, X_test, y_train, y_test = train_test_split(X, y, test_size=0.2, random_state=42)

# Train Random Forest and Gradient Boosting models
rf_model = RandomForestClassifier(n_estimators=200, max_depth=10, random_state=42)
gb_model = GradientBoostingClassifier(n_estimators=200, learning_rate=0.1, max_depth=5, random_state=42)

rf_model.fit(X_train, y_train)
gb_model.fit(X_train, y_train)

# Evaluate models using cross-validation
rf_cv_scores = cross_val_score(rf_model, X_train, y_train, cv=5, scoring='f1')
gb_cv_scores = cross_val_score(gb_model, X_train, y_train, cv=5, scoring='f1')

print(f"Random Forest CV F1 Score: {rf_cv_scores.mean():.4f}")
print(f"Gradient Boosting CV F1 Score: {gb_cv_scores.mean():.4f}")
Model Evaluation
I evaluated the models using precision, recall, and the F1 score, which are crucial for assessing how well the models perform, particularly in the context of imbalanced data. The goal was to achieve at least an 80% recall rate, ensuring that the model accurately identifies most of the popular recipes while maintaining balanced precision to avoid too many false positives.
Precision-Recall Curve
To ensure the model’s robustness, I evaluated performance across different thresholds. Adjusting the decision threshold allowed me to balance recall and precision, tailoring the model to the specific needs of the business.
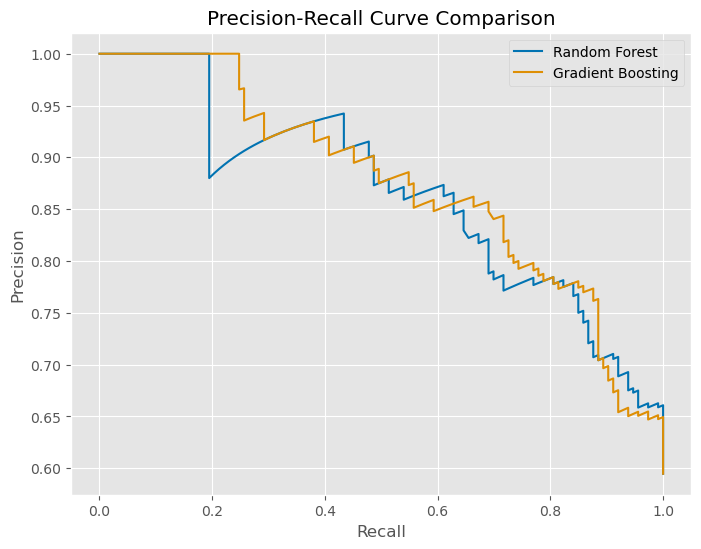
Summary:
The Precision-Recall curve shows the trade-offs between precision and recall as thresholds change. This helps in determining the optimal threshold that maximizes the ability to correctly identify high-traffic recipes while minimizing false positives.
Final Model
After optimizing the model, the final version was selected to predict daily high-traffic recipes for the homepage. This model was deployed with the optimal threshold, ensuring that it meets the business objective of featuring popular recipes 80% of the time.
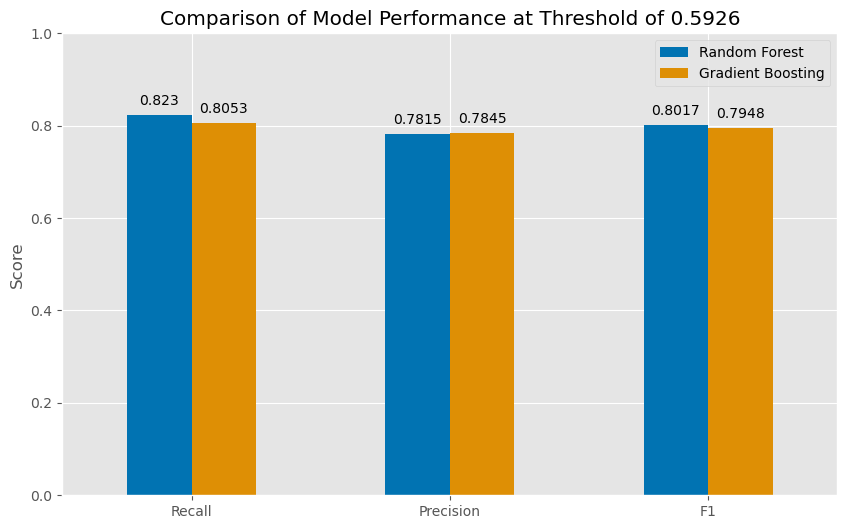
Summary:
The final model performance metrics confirm that both the Random Forest and Gradient Boosting models are effective at predicting high-traffic recipes. By fine-tuning the thresholds, the models achieve a strong balance between recall and precision, which is crucial for the business goal of maintaining high accuracy in recipe recommendations.
Summary and Recommendations
The project demonstrated that implementing machine learning to predict popular recipes can significantly enhance a recipe platform’s content strategy. The insights gained from the data analysis and modeling processes allow for targeted recommendations and optimized content placement, which ultimately drives user engagement and increases traffic.
Recommendations:
- Content Strategy: Focus on categories like “Vegetable,” “Potato,” and “Pork,” which have shown to be consistently popular among users.
- Continuous Model Improvement: Regularly update the model with new data to maintain accuracy and relevance, considering trends and seasonal changes.
- User Feedback Integration: Incorporate user feedback and interaction data to refine the model further and adapt to changing preferences.
- Explore Advanced Models: Consider experimenting with deep learning techniques or ensemble models to capture more complex patterns in the data.
Reflecting on the Journey
This project was more than just a technical task; it was a journey of personal and professional growth. Transitioning from a long career in accounting to data science presented its own set of challenges, from mastering new analytical techniques to understanding the complexities of predicting user behavior based on recipe data. These challenges pushed me to refine my skills in data processing, feature engineering, and model evaluation, emphasizing the importance of adaptability and continuous learning in the dynamic field of data science.
Conclusion
Implementing machine learning for predicting popular recipes significantly enhances the ability to optimize content on recipe platforms, ensuring that users are presented with recipes that are most likely to engage them. By applying these models and techniques, businesses can build robust content strategies that adapt to user preferences and drive increased traffic and engagement.
Discover the Full Story
To explore the full analysis with all executed code, outputs, and visualizations, see the complete notebook on NBViewer.


.jfif)